Sales
Sales statistics, KPIs, ABC analysis, Gini index and Lorenz curve to see concentration and prioritise products in Shopify.
 Rentabilia
 is a Shopify app for small stores: it turns orders into KPIs, ABC analysis, Gini index and Lorenz curve, trend-and-seasonality forecasts, CPI-deflated real sales, NPV/IRR/payback and a decision matrix.
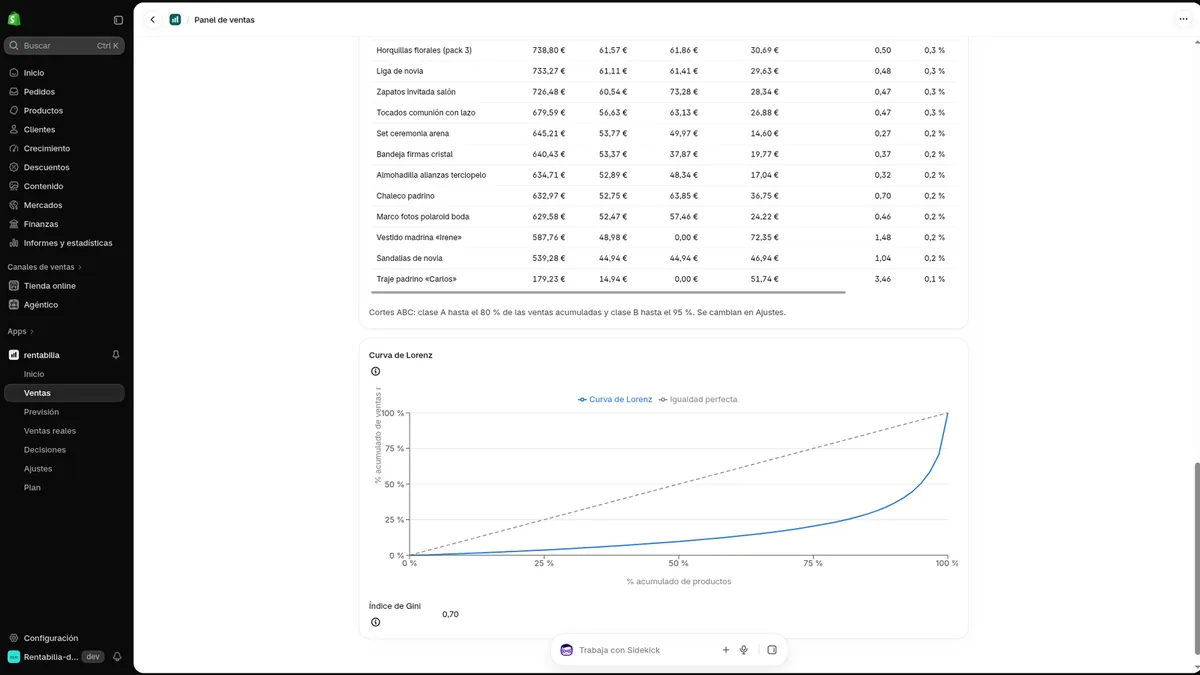
Rentabilia combines sales statistics, the Gini index, the Lorenz curve and ABC analysis inside Shopify. Real screenshots of the app in a demo store.
Sales statistics, KPIs, ABC analysis, Gini index and Lorenz curve to see concentration and prioritise products in Shopify.
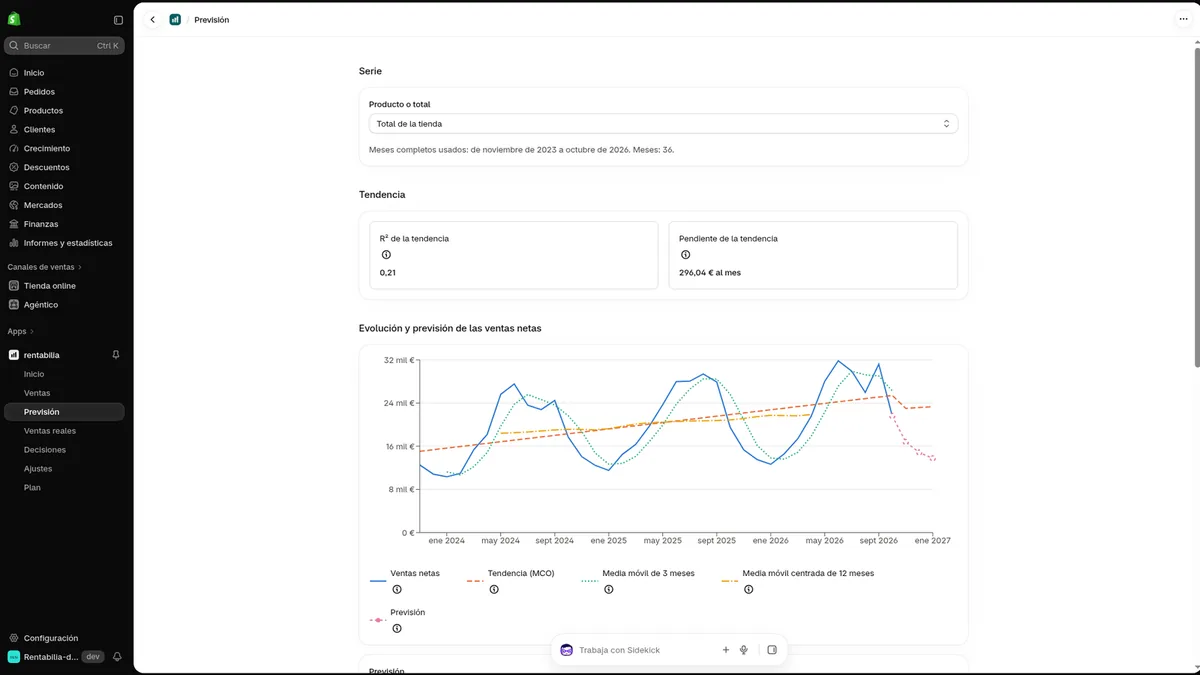
Rentabilia's forecasting module applies trend and seasonality to Shopify order history.
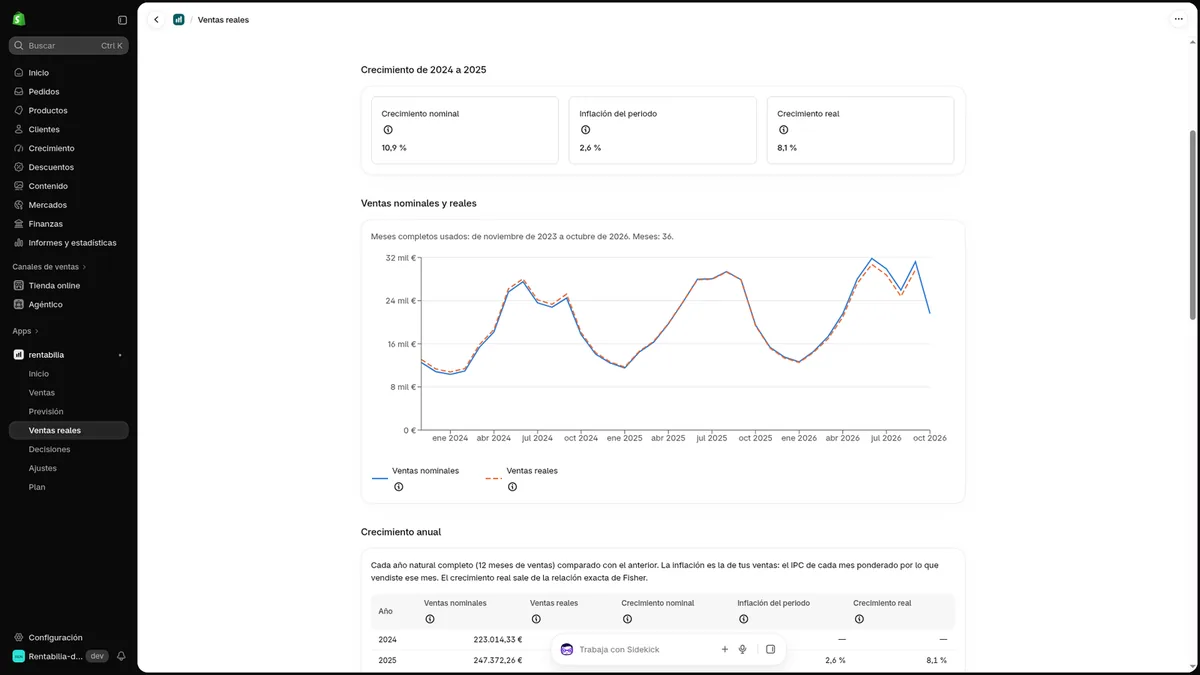
Rentabilia deflates sales with Spain's INE CPI to compare real purchasing power with the nominal series.
Rentabilia calculates NPV, IRR and payback before you commit store investment spend.
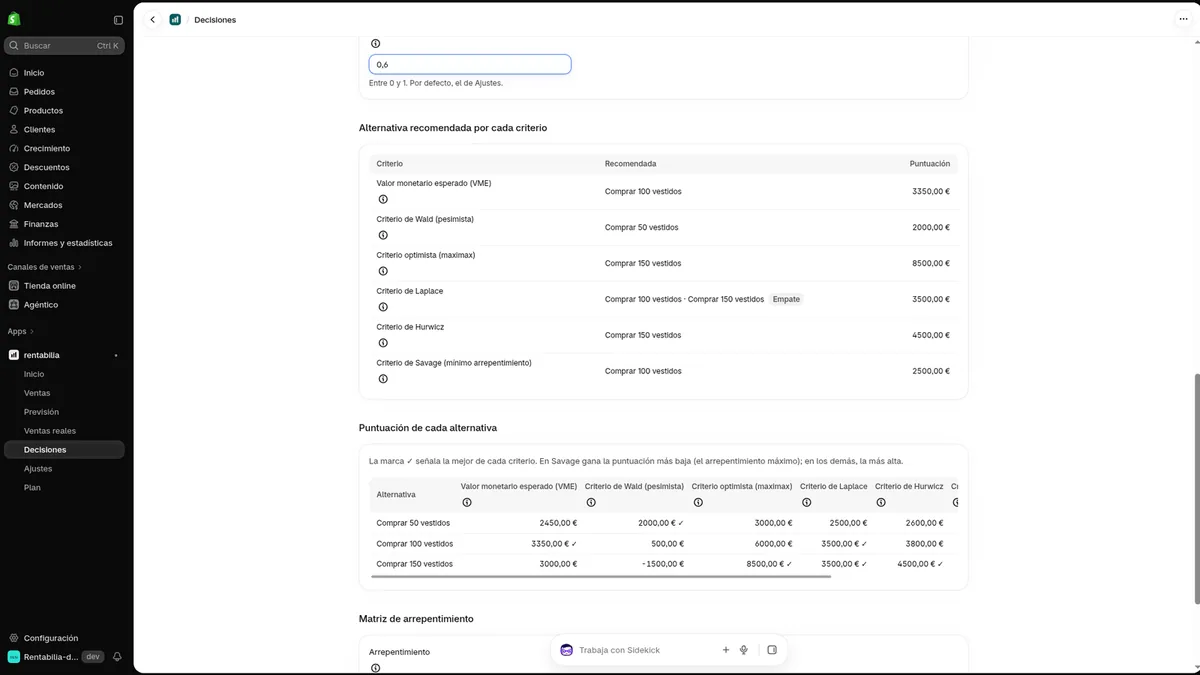
Rentabilia's decision matrix supports EMV, Wald, Laplace, Hurwicz and Savage criteria.
Start on the Free plan. Move to Pro (9.99 USD/month or 99 USD/year) with a 14-day free trial when you need more history and tools.
Pro billing is handled by Shopify App Pricing on your Shopify invoice. Rentabilia never stores payment details. Rentabilia's Free plan costs 0 USD and includes all five modules with 12 months of history.